A handy guide to YouTube analytics for influencers
Influencer marketing has emerged as one of the top marketing techniques in 2018, giving rise to a high number of YouTube influencers trying to break the Internet with their engaging videos. After Google, YouTube is the second largest search engine in the world. So it makes perfect sense for influencers to capitalise on this goldmine of opportunities by creating quality content for the audience. In doing so, it’s also important to track the performance of your videos, know if it’s reaching the right target audience or not and learn if the viewers are sticking around till the end of the video or dropping off somewhere in the middle. All these data can be acquired through YouTube analytics which will help you get a deeper understanding of your video’s performance and you can alter your content consequently. Following are some of the key metrics that hold paramount importance in YouTube Analytics. Learn how to use them to enhance your video strategy.
Watch time and re-watches
There’s no denying the fact that YouTube views are an important measure of a video’s success but you shouldn’t stop with just that. The number of views that a video earns can sometimes be misleading, given the prevalence of clickbait hacks and tactics. Hence, it’s essential to delve a bit further and understand how long people are spending time watching the video. What gives you a clearer picture of the video’s performance is its watch time – the cumulative sum of minutes a viewer has spent watching your video. This important metric in YouTube analytics is the key to getting on the good side of YouTube’s algorithm. YouTube will automatically recognise the videos that have a good watch time and elevate it on the search rankings.
A re-watch is another important metric. It determines the number of times a viewer re-watched a specific part of the video. This divulges insight on which part of the video was most liked and enjoyed. If a viewer comes back and watches a part of the video again, it most certainly means that you’ve piqued and retained his interest through your content. You can access this graph under the absolute retention section.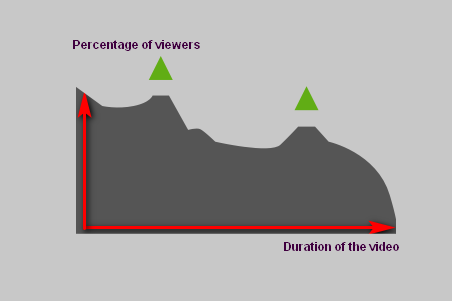
The upward peak in the trend indicates re-watches.
A unique number of viewers also helps you understand the audience size. Unique viewers are the number of different people who watch your video over a specific period of time. Whether they have viewed the video on a desktop, mobile or watched more one of your videos, this person is tagged as a ‘unique viewer’. If your unique viewer count is less than your subscribers it means you are not engaging your subscribers. You can find this metric under the Reach Views and Audience tab in the Youtube Analytics.
Impressions Click-Through Rate
The impressions click-through rate is a measure of the capability of the video to persuade the viewer to click on it. It essentially means how many clicks are being made on the video after it is shown on the recommended section, homepage or the trending section. A high click-through rate can be achieved only if your videos have a compelling title and a captivating thumbnail. In order to create videos that convert, it’s important to choose topics that are relevant and interesting to the crowd.
You can couple this derived information with the set of data on views to learn if the high click-through rate has any actual value or not. If people are clicking on your video but the watch time is less then it’s clear that there’s something wrong with the content you’ve produced. Try to create thumbnails as accurate as possible because deceiving your viewers into clicking on your video can make them lose their confidence in your work.
Demography
To have a better understanding of who your audience is you can visit the demographics page under YouTube analytics. The elusive graphs will help you determine the age, gender, geography, device and more dimensions like these. You can use this wealth of information to your advantage and analyse if you are catering your content to the right people. For example, if you’re a beauty blogger or one of the top YouTube influencers in India with females within the age group of 20-40 as your target audience, you can review if the videos are being watched by them or not. If not, come up with new strategies to attract and engage your niche of people.
Card click-through-rate
Cards are panels that are incorporated in the video which appears while watching. It encourages viewers to perform a certain action like watch another video, subscribe to another channel or visit a website. This click-through-rate will inform you which cards are fulfilling their purpose and which are not. You can place the most engaging card in your video and eventually grow your subscribers count and watch time.
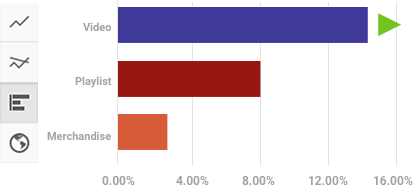
Source: YouTube
The above graph will show you which card has got the most number of clicks.
Traffic sources
While analysing your video’s reach, it is important to take a look at the various sources of traffic. This will help you understand how your viewers are finding your videos. In the YouTube analytics panel, in the traffic sources section, you will able to view the different sources with the amount of traffic flowing in. This detailed report allows you to determine which source has been the most beneficial for you and which sources need more work. For example, if your video is attracting an enormous number of viewers through the YouTube search page, then the next logical step would be to optimise your content with relevant keywords and meta descriptions. This will improve your chances of discoverability. Otherwise, if most of your viewers are coming through Facebook or any other social media platform, then it makes perfect sense to shift focus onto social media promotion.
Playback locations
The playback locations report can help you determine where your videos are being viewed, whether on YouTube or external websites. Through this, you can gauge your video’s popularity on and off YouTube and adjust your promotion strategy accordingly. You can further make a decision as to where you should spend your resources- YouTube optimisation or getting your videos embedded in external websites and blogs. Getting your first 1000 YouTube subscribers from high-authority websites will ensure that you rank higher on Google.
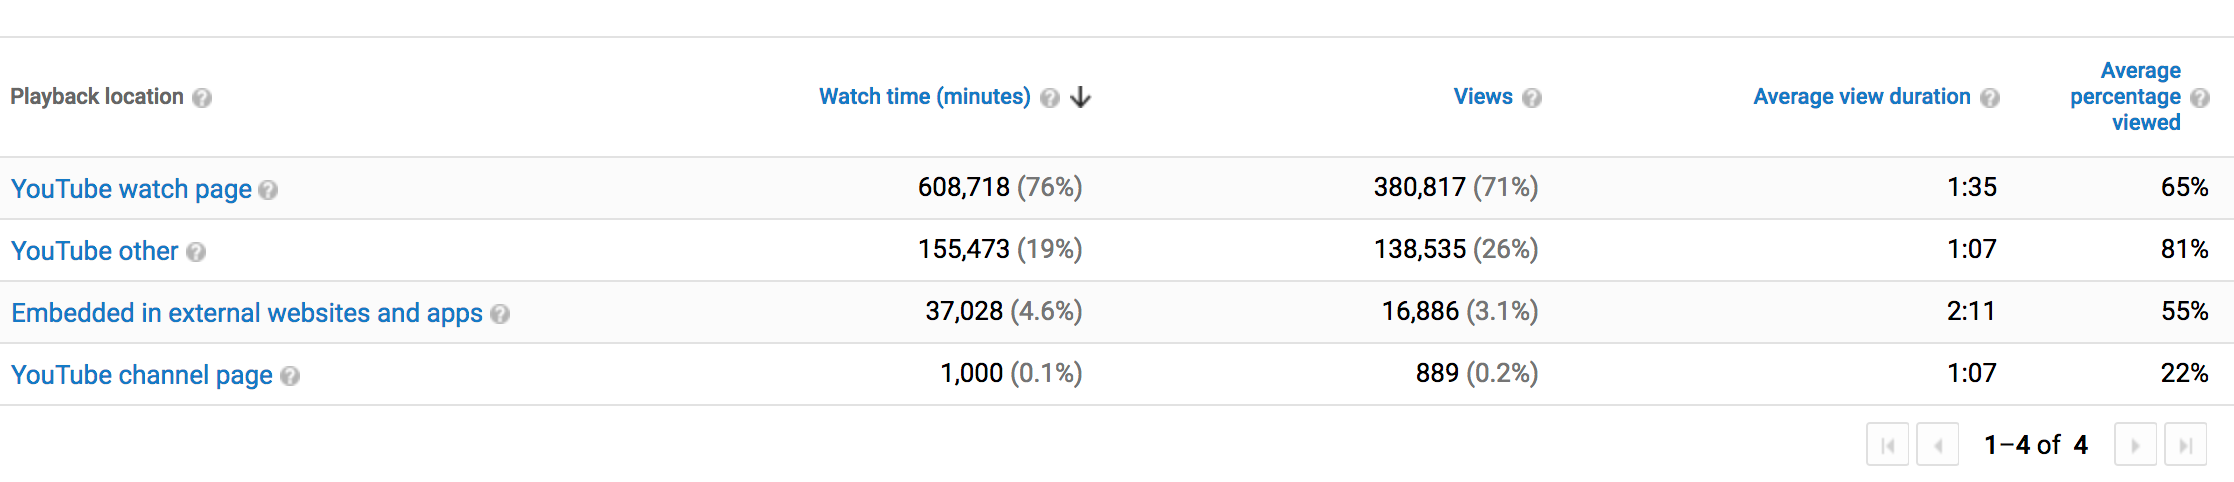
As you can see, the different sources can be listed in the report with individual average view duration and number of views.
Audience retention
Audience retention is truly an ingenious metric in YouTube analytics that all the influencers must pay keen attention to. This metric allows you to uncover the exact time at which the audience quit watching your video. Using this information you can determine exactly where you lost your viewer’s attention and avoid making similar mistakes in the future. For instance, people tend to skip through long introductions and jump right into the crux of the video. You can check if your viewer exhibits the same tendency. If yes, tweak your videos and start with short, crisp and concise introductions.
There are two main graphs that you can view under this section.
Absolute audience retention:
This graph reveals to you the percentage of viewers watching at a particular point in that video. Through this, you identify which parts of the video are most popular and also recognise different viewer behaviours like skipping through the introduction.
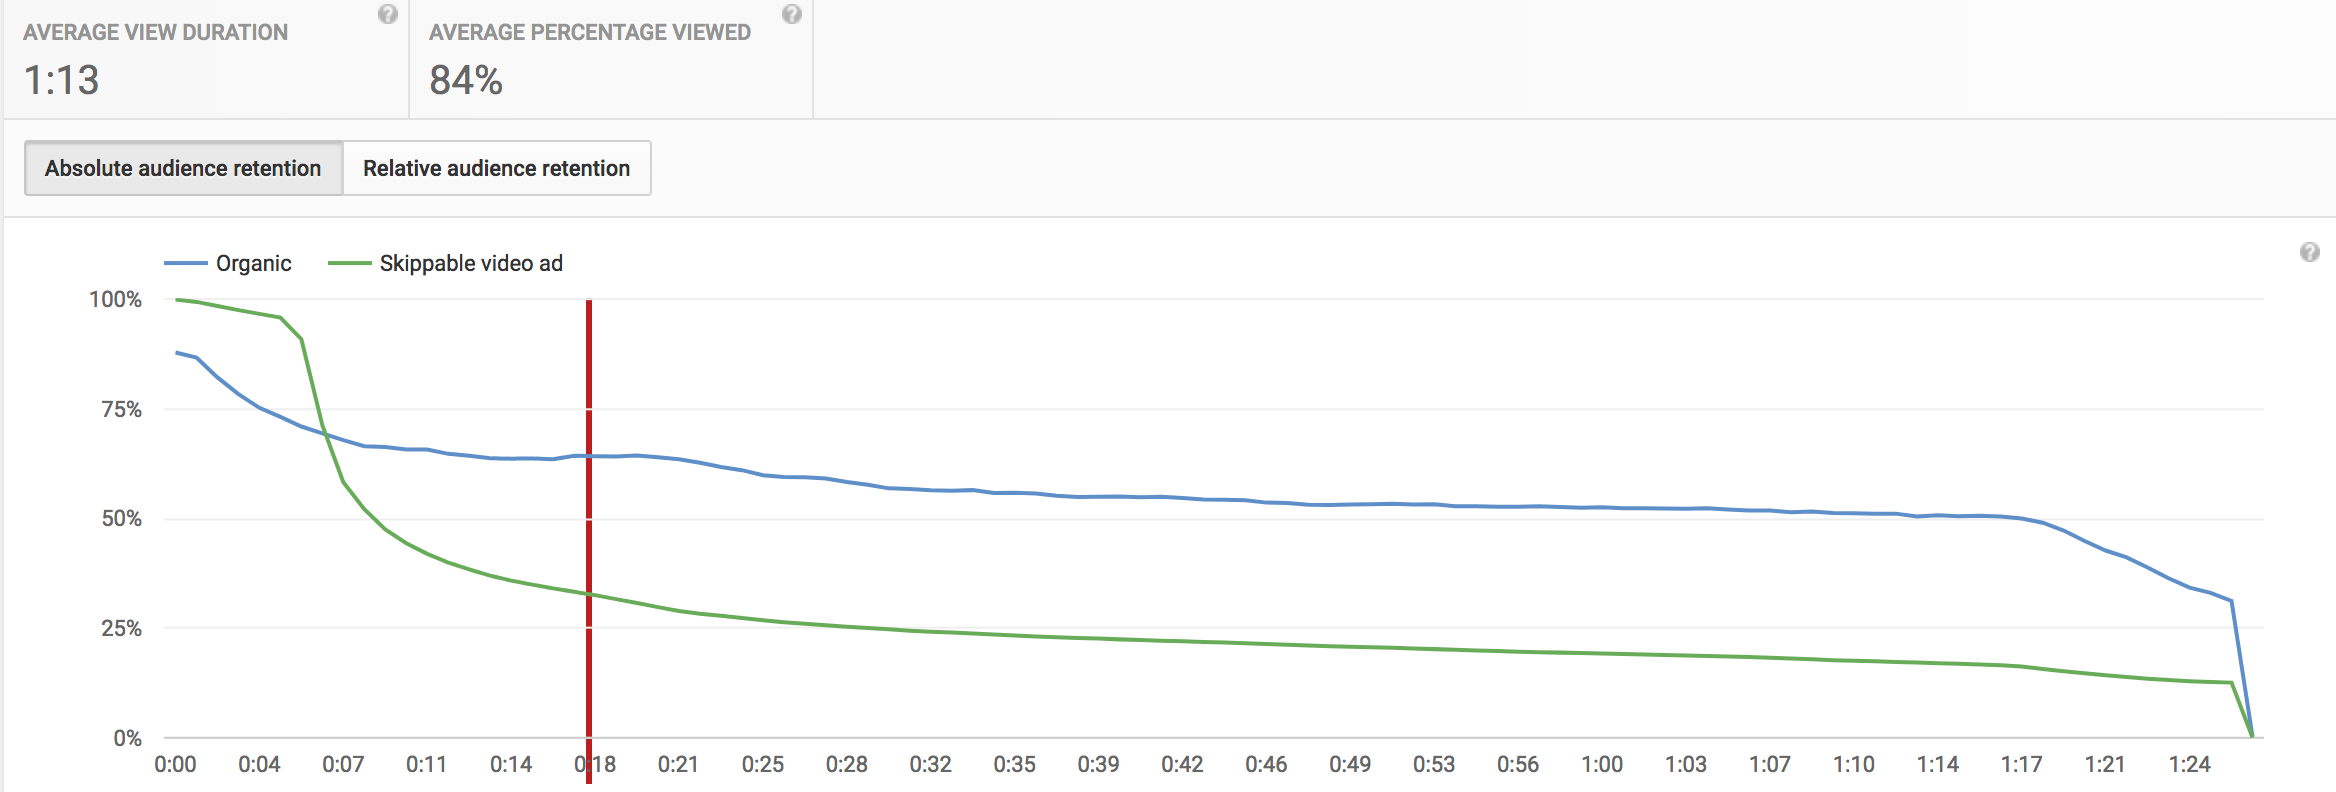
You can infer from the graph the average view duration and average percentage viewed. It reveals that 84% of the audience has watched the video until the end. For short videos, the percentage is usually high.
Relative audience retention:
With the help of this report you can compare your video against another YouTube video and draw inferences from it – like determining if you are below or above average in terms the attention span of the viewer.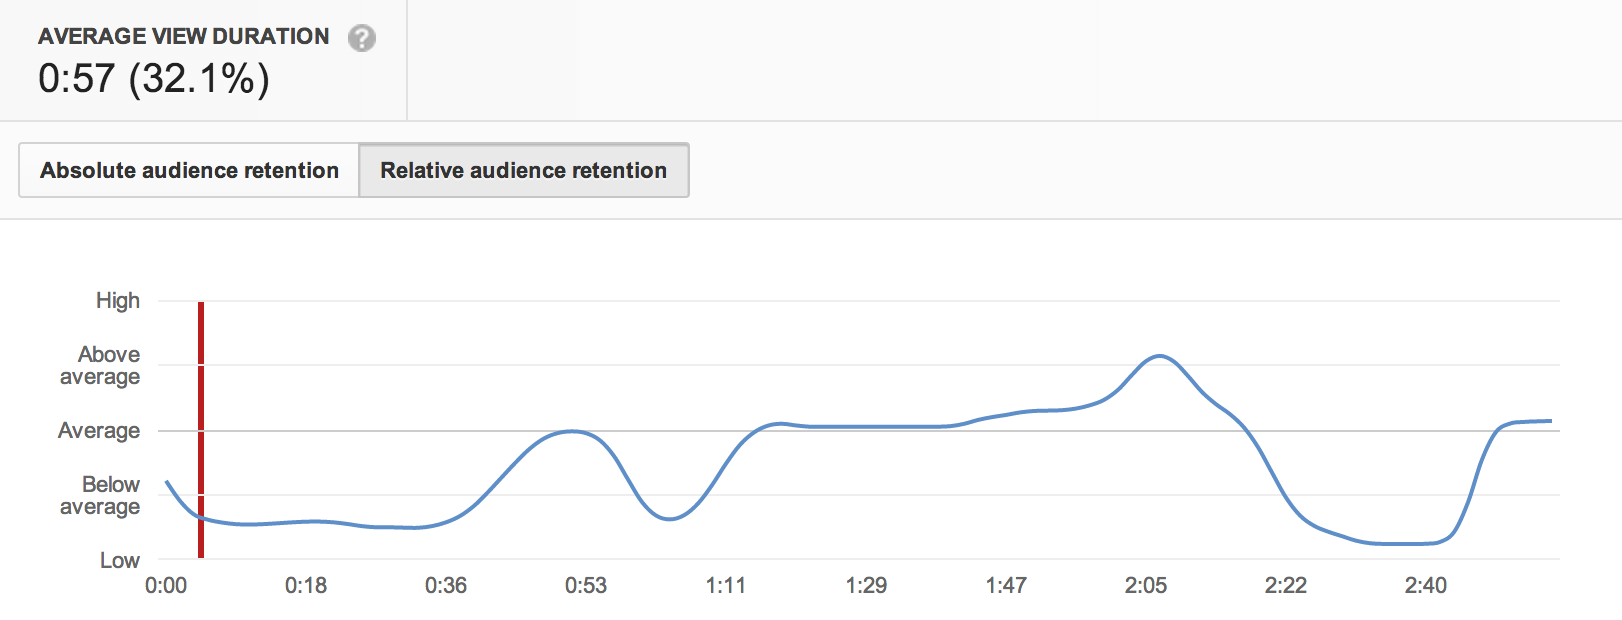 From the above graph you can compare your video’s performance with the average standards throughout the duration of the video.
Engagement
There’s no doubt that a video that receives most likes, shares, and comments has a higher level of reach and engagement amongst the audience. Measuring the engagement caused by your video is a great metric that resonates on its performance. The For example, the comments made by viewers will give you a better understanding on how well the video has been accepted by your audience. If your video provoked a certain thought in them, established an emotional connect or solved their query, the chances are high that the viewers will leave a comment. Likes and dislikes, on the other hand, can help you figure out which topics are doing well and which ones are not. In correspondence to that, you can alter your content and create videos that your audience genuinely enjoys.
Subscriber rate
YouTube’s subscribers report will give you information on the number of subscribers you’ve gained and lost with every video and will bring you one step closer to your first 1000 YouTube subscribers. It’s important to monitor the fluctuation in the subscribers count as they are your most ardent fans and if they are unsubscribing to your channel, then there’s something you are not doing right. To achieve higher engagement with your audience and high watch time, you must create content that makes them keep coming back for more.
Devices
This report lets you know what devices and different operating systems the viewers are watching from. Few of the most common devices are desktops, mobile phones, tablets and game consoles which can be further broken down for you to dig deeper into the data.
If most of your users are consuming your content through mobile phones, you need to make sure it is optimised for the mobile screen. All the thumbnails and images used should be easily viewable. Furthermore, mobile users prefer watching shorter videos so with the use of this information you can create device-friendly content. On the other hand, if most of your traffic is flowing in through desktops, then it’s best to compile your videos into theme-based playlists. It offers a continuous flow of videos without any interruption, eventually boosting your number of views and watching time.
With the help of these comprehensive set of YouTube analytics metrics, you can gauge how well your videos are performing and recognise the areas where there’s scope for improvement. You can also check out our blogs on the top SEO tools for better Youtube marketing and how to turn your blog posts into videos for more insights.


Trending


Related Posts